Structured logging with Durable Functions and Application Insights
There’s a big difference between logging for debugging/development purposes and for monitoring your application. When developing it’s quite easy to write a line containing something similar to this log.LogInformation($"The code reached this function with id {id}"). And this is valuable when debugging the code, but when you’ve deployed it and something behaves unexpectedly, and all you have to go by is thousands of lines of “The code reach this function with id X”, then it’s not that much fun anymore. In this case you would probably want a way of correlating different log entries to see the actual flow of the application, which could potentially show you why it’s behaving incorrectly. You would probably want to query the logs by the effected id, and filter on specific types of log entries.
This is something that structured logging may help you with, and something that we actually get for free when using Azure Functions (both Durable and regular Functions). It is however a bit hidden in the documentation, and only alluded to in some places.
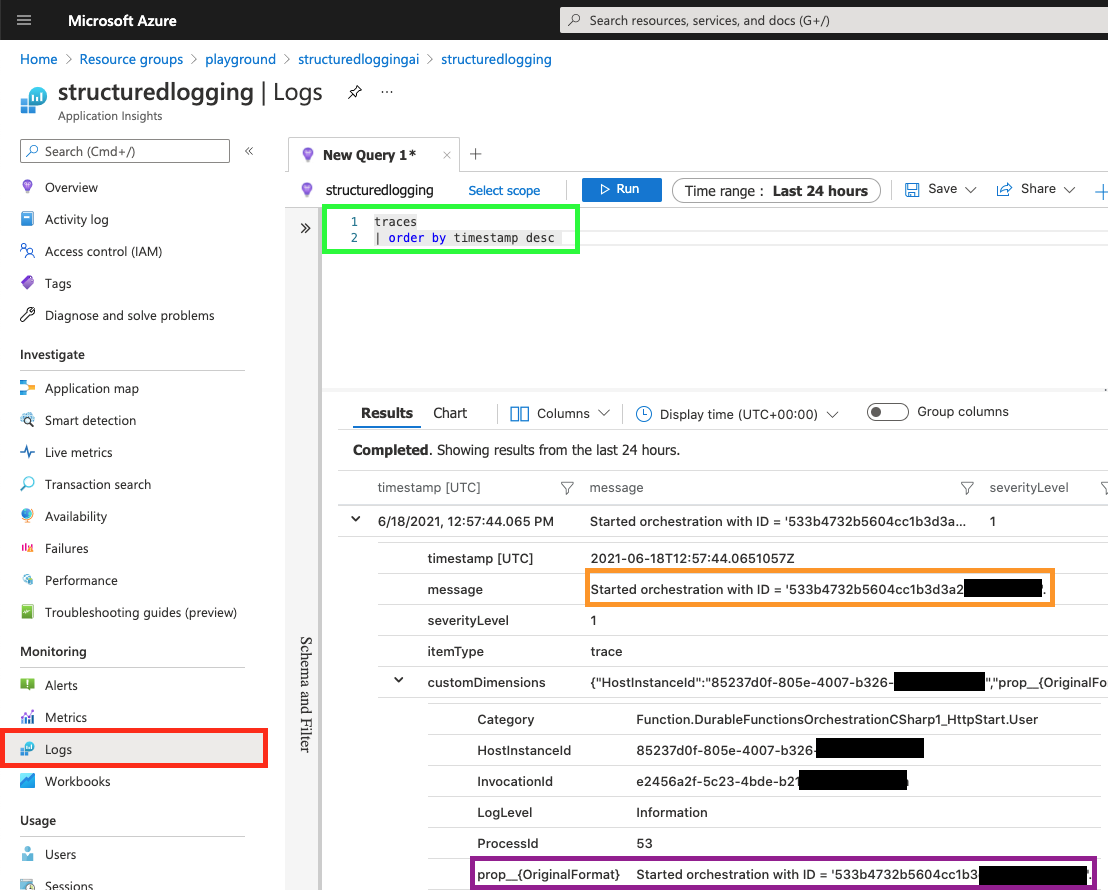
If we run this example from the docs (which is also the same code you get if you generate a new Durable Function in VS Code) while connected to Application Insights, then we get the following log entry if we query for it in Application Insights.
Notice:
- If you’re unsure of where to go in Application Insights, then navigate to “Logs” (highlighted in red).
- The query (highlighted in green) that queries for traces (which is what
LogInformationgives us). - The
message(highlighted in orange) “Started orchestration with ID = ‘533b4732b5604cc1b3d3a2…”, which is what we expected from our code (log.LogInformation($"Started orchestration with ID = '{instanceId}'.");). - The
customDimensions > prop__{OriginalFormat}(highlighted in purple), which might be expected, depending on how used to working Application Insights you are.
This is an example of unstructured logging, it logs a message containing exactly what we put into it. We could query this using free text, something like this might give us related logs:
traces
| order by timestamp desc
| where message has "533b4732b5604cc1b3d3a26ec68af38e"
Which gives us every log entry containing the id. This will however get cumbersome when we want to filter out specific types of logs, or we want to group/aggregate logs based on their id (unknown to us when we query).
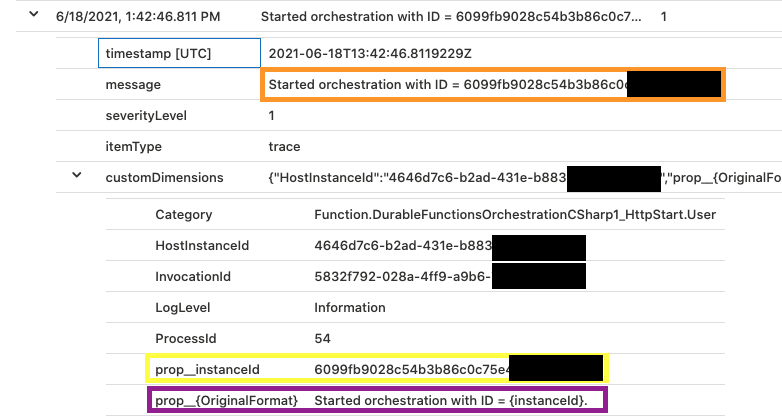
If we instead change log.LogInformation($"Started orchestration with ID = '{instanceId}'."); to be log.LogInformation("Started orchestration with ID = {instanceId}.", instanceId). Notice how we changed the string from using interpolation to get the instanceId into the string, to using the token {instanceId}, and then providing the variable instanceId as a parameter to log.LogInformation(. They are quite similar, but gives us different results when sent to Application Insights as we can see in the following screenshot:
Notice:
- The
message(highlighted in orange) still showing us the full message “Started orchestration with ID = 6099fb9028c54b3b86c0c”. - The
customDimensions > prop__{OriginalFormat}(highlighted in purple) now looks a bit different from the previous screenshot, it now contains the exact same token as in our code. - The
customDimensions > prop__instanceId(highlighted in yellow). This is a new property incustomDimensions, and this is the one we’re after here. Application insights will extract all tokens ({nameOfYourToken}) in our call tolog.LogInformation(and the other log methods), and save them as key value pairs (in the format ofprop__nameOfYourToken), giving us the ability to query them.
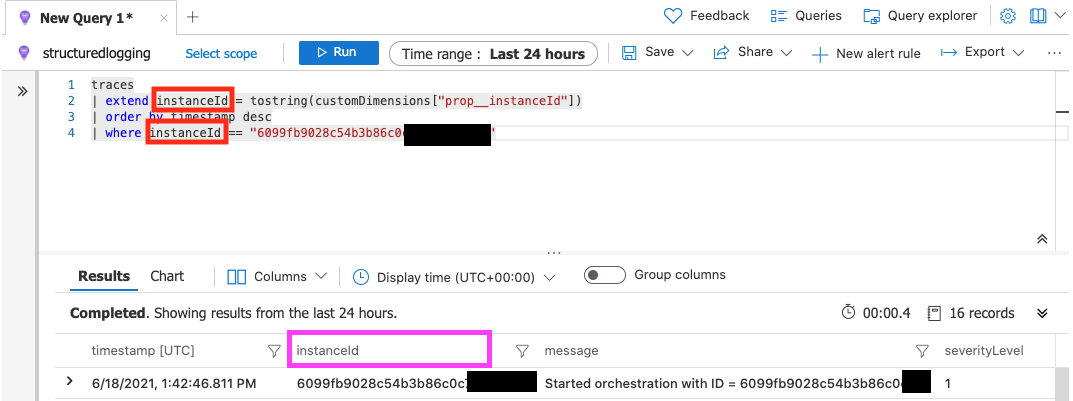
We may now write a query such as this:
traces
| extend instanceId = tostring(customDimensions["prop__instanceId"])
| order by timestamp desc
Which would give us something like this:
Notice:
instanceId(highlighted in red). We’re now extracting theinstanceIdfrom the log, giving us the ability to use it in our query, to filter, aggregate, or anything else that Kusto allows us to do with any query returned for a log item.- The column “instanceId” (highlighted in pink) which is now a part of our result set columns.
Conclusions
This example has been very contrived, but structured logging gets very powerful when you use the same “token” names for the same properties/concepts throughout all of your logging in your application, all of your functions, or multiple applications that sends data to the same Application Insights instance.
Versions used
- .NET core 3.1
- Microsoft.Azure.WebJobs.Extensions.DurableTask v2.4.3